
Florida Realtors economist: The RE market has slowed, but not to levels reflected in doom-and-gloom headlines – especially in some local Fla. markets.
ORLANDO, Fla – Anyone who reads real estate news regularly has bumped into some of the following headlines:
- Explosion of Inventory
- Median Sales Price Plummeting
- Houses are Sitting on the Market Longer
- Where Have All the Buyers Gone?
- Sellers are Forced to Accept Discounts – and the list goes on
Really? Really? These and other exciting headlines are written to draw eyeballs to the story. While rooted in some fact, they can be misleading, particularly if it’s written at the national level, or comparing the U.S. West Coast or Northeast to Florida. They can even be misleading if comparing regions within Florida.
Your clients look to Realtors to tell them what’s happening in their local market when considering a transaction, and you have a tool that can do that. SunStats – a free tool for Realtors in Florida – is key to delivering actionable facts that speak to your area, providing you know how to use it and what to look for.
Fortunately, there are a few key things that will help you go beyond the headlines.
Be wary of comparisons to boom years
2020 and 2021 will go down in history as two of the most spectacular and anomalous years for residential real estate. Records were broken all over the place – Median Sales Price and Dollar Volume were metrics that hit particularly high watermarks during that time. Comparing where we are today to such high numbers will result in a seemingly drastic decline.
Instead of looking at year-over-year comparisons (where you’re comparing anything to 2021), look instead to 2019 when the market was still somewhat normal. You can do this directly in SunStats by looking at monthly or annual numbers to get a broader picture of the marketplace.
You may even see that current prices, when compared to 2019, are still above what the market was doing then. Prices may be below 2020-2021 numbers, but that’s to be expected.
Know what “normal” transaction pacing is
Take a look at Median Time to Sale. This metric looks at the median amount of time it takes to go from listing to close. We know that the pace of sales was astronomically fast in 2020-2021 – almost too fast – an unsustainable pace of doing business, according to many Realtors who have been through previous business cycles.
If you look at the quarterly Median Time to Sale numbers in your area from 2018-2019, you’ll see what the typical pace was. While homes take longer to sell today relative to the crazy pace of 2020-2021, property still closes faster than it did in 2019.
In the third quarter of 2019, for example, homes took 67 days to close in Lake Mary, my local area. Today, it takes 46 days. That’s up a day from the previous quarter, which might be used in news stories to indicate the market is slowing. However, homes still sell 31% faster than they did pre-pandemic.
Understand the nuances of Active Inventory
Knowing what’s actively on the market, or Active Inventory, gives you a sense of how much available property buyers have to consider. When demand outstripped supply, sellers could fold their arms and name their price. And buyers, fueled by cheap debt, were all too willing to accept astronomical prices to get the deal done. But when there is more stuff on the market, buyers start to get choosy.
This metric is important because it shows you how robust the local for-sale market of existing homes is. Some recent headlines focused on the month-over-month uptick in homes going up for sale and then leaped to the conclusion that houses are flooding the market. This is where you can get creative with SunStats and drill down. Find the story in your area. Select Active Inventory by Price Tier to see which segments of the market truly are limited and which ones offer more options.
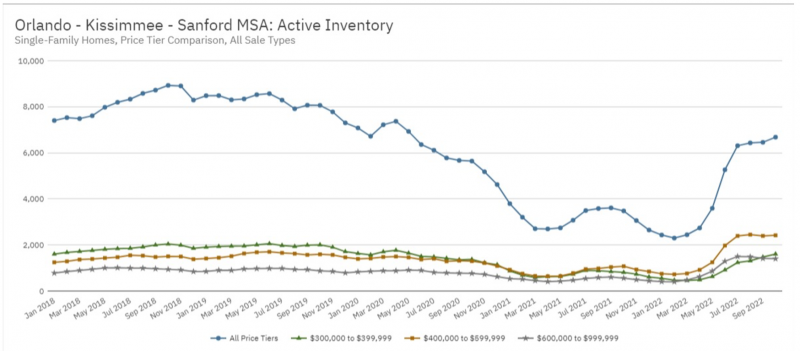
Yes, inventory has increased in recent months, but overall levels are still tight compared to where we were prior to 2020 – hardly an inventory explosion.
In addition, you can see in this Orlando example that more homes in the $400,000-$599,000 price tier are going on the market than in other tiers. This tells you that one segment of the market is potentially offering more options, but other segments may still be very tight. For sellers, it might suggest that they price their home a bit less so it’s at the top of a price tier with less inventory rather than place it in a higher-priced tier where they’ll face more listing competition.
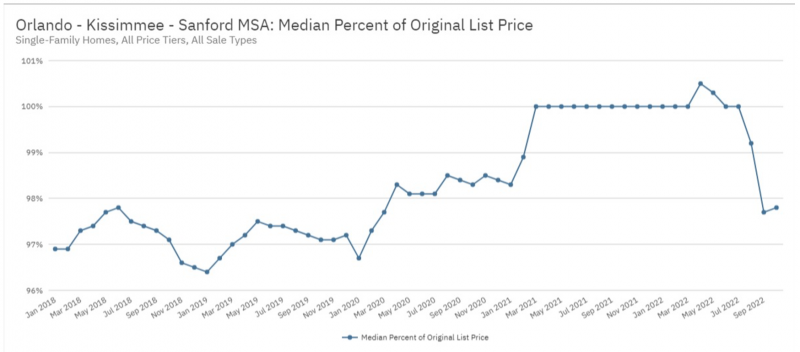
Seller discounts
When looking at market statistics, remember it’s all the qualifying deals in an area rolled into one number. Of course, each deal carries its own story. That said, the metric Median Percent of Original List speaks to how close sellers come to achieving their list price. Take a look in your area to get the story, and again, walk your analysis back a few years.
After months of sellers achieving 100% or higher of their original list price, some softening is starting to show up in the data. Still, we’re looking at a 2-3% discount in the Orlando MSA, which is right around where we were in years past. While sellers aren’t in the drivers’ seat as much, we’re nowhere near seeing deep discounts reverberating through the marketplace.
Takeaway
Take the time to understand your market. It will help ensure you know what’s really going on in your area.
Top-of-the-fold headlines may not always be the story for you, and your clients will benefit from your local knowledge. In addition to SunStats, your local association is a key resource to understand what’s happening, so check in with them regularly for market updates in addition to doing the work yourself in SunStats.
Jennifer Warner is an economist and Florida Realtors Director of Economic Development
© 2023 Florida Realtors®
Go to Source
Author: kerrys